Opvizor Health Analyzer Reporting Overview

I recently received my vExpert NFR license from Opvizor to try their health analyzer tool. For a nice overview of the install process, Michael White has a great post. There really isn’t much to the setup at all, and it is quick and easy to get up and running. Once the setup is complete, the dashboard with your VMware infrastructure info is available. Roger Lund navigates through the dashboard components in this post. What I’m really looking to focus on are Opvizor’s reporting capabilities.
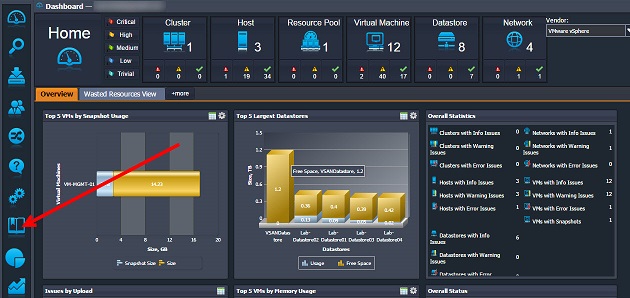
Reporting Dashboard
To access reports from the dashboard, on the right hand side select the notebook like icon.
One thing to notice is there no shortage of reports. To be exact there’re 17 default reports available ranging from Network to Issue Urgency.
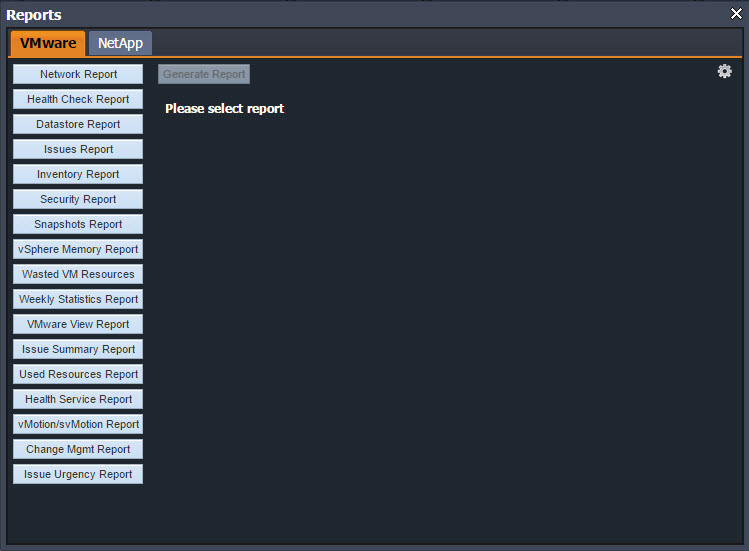
To view a report, select one and click generate report. Once there’s a green check mark under state, select the report type of HTML, PDF, or CSV.
Some of these reports would require scripting or even another product to gather the information from your vSphere environment. Of course while all the reports in this list are helpful, it would take a rather longer blog post to demo every single one. Here are a couple examples:
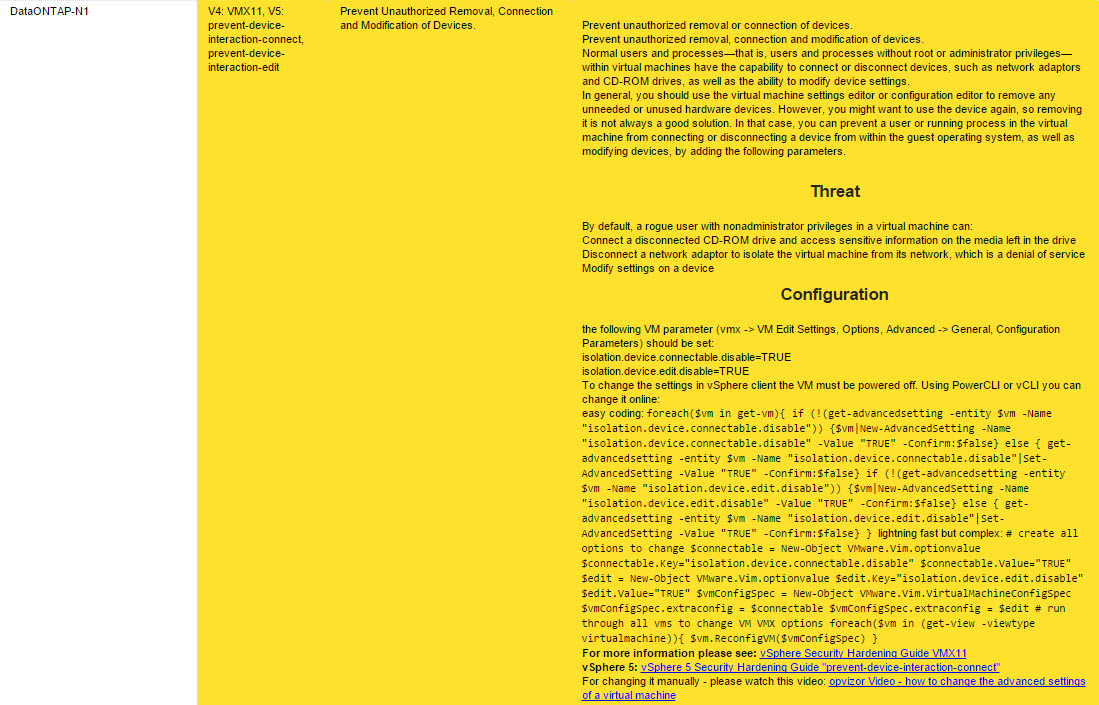
Security Report:
- Description of the issue(s)
- Provides the risk / threat related to a particular setting(s)
- Negative Functional Impact
- Configuration – Current setting and how to make the necessary changes including any caveats, such as VM must be powered off. Options for making the changes (fixing) include vSphere Client, PowerCLI, or vCLI. A reference source to the best practice, one example is the vSphere Hardening Guide. In most cases a how to video is also provided.
Note: The report also color coded for higher priority issues. For example an item highlighted in yellow is considered a higher priority.
Inventory Report:
A very detailed report of of your vSphere environment ranging from Host information down to attached VM devices.


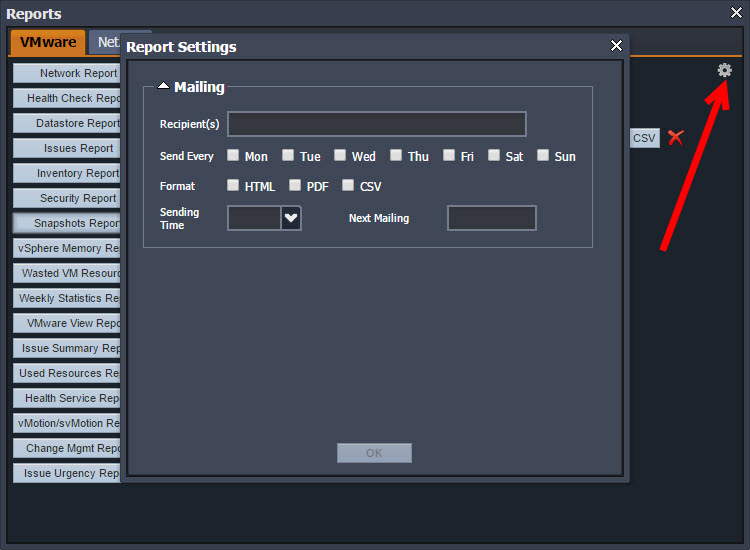
Report Settings
There is an option to automate the delivery of the reports, since we all know that management wants them first thing Monday morning. Selecting the cog icon in the upper right hand of the reports screen, opens the reports settings window. As you can see the report settings screen is simple and straight forward.
Summary
As you can see, Opvizor comes with a great deal of standard reporting right out of the box. To add more reports, or customize them further, there are a few options. First would be submitting a request, which they call “make a wish”. Next is leveraging the REST APIs or PowerCLI to extract the necessary data. Finally, you can use the CSV files from various reports, and modify them to your linking. One of the features I would like to see is the ability to send multiple reports at once, so sounds like I will be submitting request, or making wish in this case. If you are a vExpert, Opvizor is providing a NFR license here, and they also have a free edition that supports one cluster. The free edition is more than enough to get started and evaluate.